

Secrets to a High-Performing Property
Learn the ingredients required for a high-performing property.

Two Similar Properties
Have you ever wondered why some properties consistently have higher occupancy rates, ADR, and yearly revenue than others in the same market? We have.
In one of our markets, we started to manage a property very similar to a property we were already managing. Both properties were in similar locations, had similar amenities, and had similar descriptions, yet one was generating 50% higher revenue than the other. What was the secret sauce? Was it just luck?
Now that we had both properties in our hands we could dig deep to see the differences and what kept one property with a much higher page rank the other other.
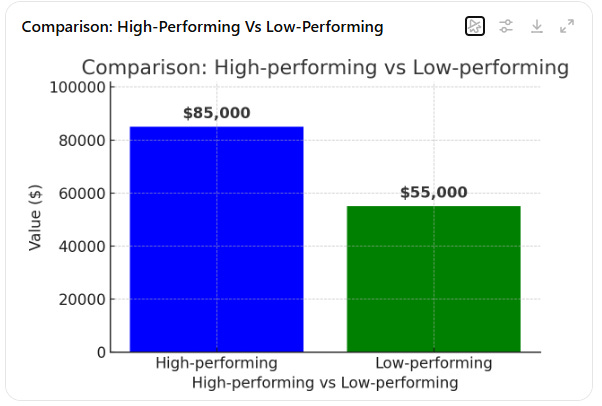
The new property we started to manage had a previous co-host wasn’t bad and perhaps made a few mistakes, but nothing major. And yet the revenue difference in 2024 was significant. Our existing property had an annual revenue of 85K and this new property had an yearly revenue of 55K. AirDna reported an average revenue for this type of property at 60K.
So, this second property was slightly below average, but a whopping 30K lower than our existing high-performing property.
So what are differences? First a little bit about this market.
Constrained Market
Some of the properties we manage are in markets that are constrained, where, due to licensing restrictions during the busy season, occupancy is at 80 or 90 percent and low season is still in the 50 percent occupancy.
In contrast, other properties are located in markets with little to no entry restrictions, resulting in a really high saturation of empty places in the low season and downward price pressure during the high seasons.
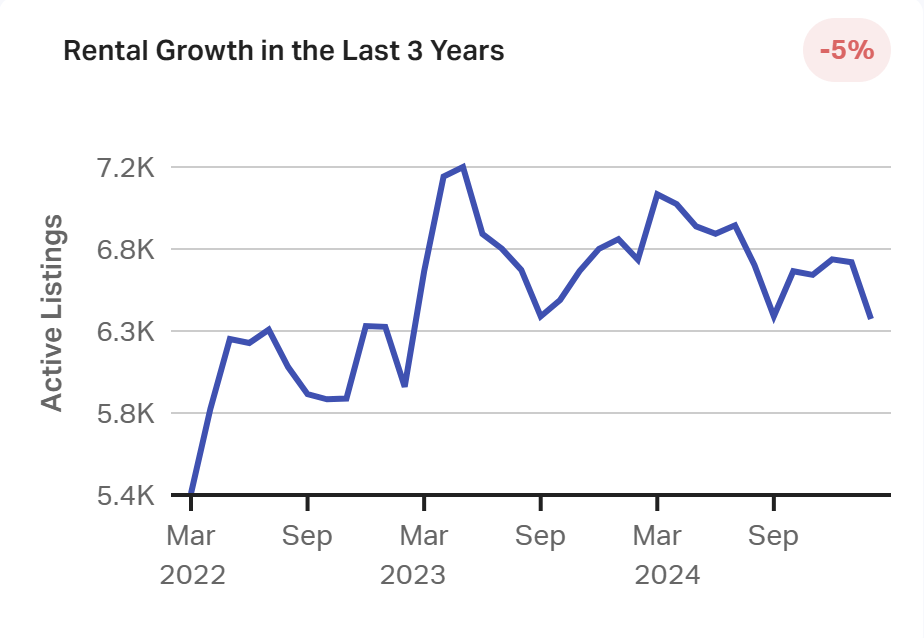
These two properties are in a market similar to Tampa, FL, with little barrier to entry. When we first started to manage a property in Tampa, FL, the area had just shy of 1K STRs. Fast forward 5 years, and there are now over 6K STRs. That is an increase of 500%. Nights booked has also gone up in the past 5 years, but nowhere near 500%.
The other item we can tell by this graph is that there are owners dropping out…..the high was 7.2K properties about a year ago and the number of STRs seem to be slowly decreasing. We can only assume that some of these STRs are turning back to LTRs.
Statistics
One of the first analyses we did was a deep dive in various stats. For this we used Rank Breeze . Rank Breeze is excellent for monitoring Airbnb page rank and various statistics. While some of these statistics are accessible within Airbnb, others are not.
Views
Views are the number of times the property appeared for a guest or potential guest. The high-performing property is getting a LOT more views than similar properties. In some months as many as 10X more views.
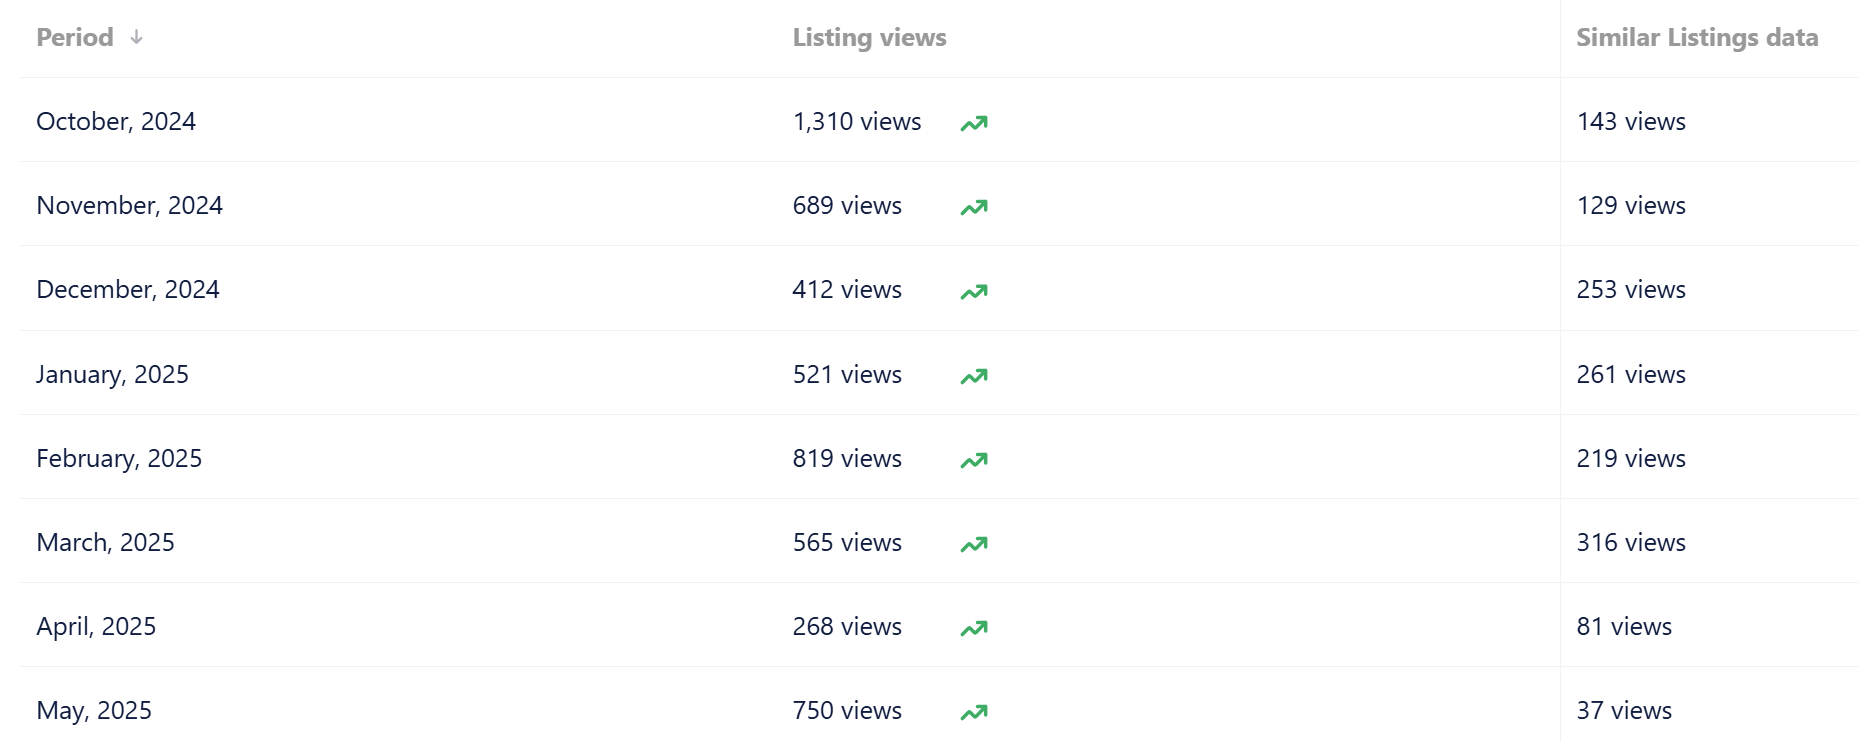
The low-performing property had literally the same stats as average. Some months a little higher and some months a little lower.
This makes sense since we know the high-performing property has a higher page rank and will get more page views.
Click-Thru Rate
The click-through is the rate when guest or potential guest clicks on your property. This rate was also higher in the high-performing property, but it did have a few months where it was just about average.
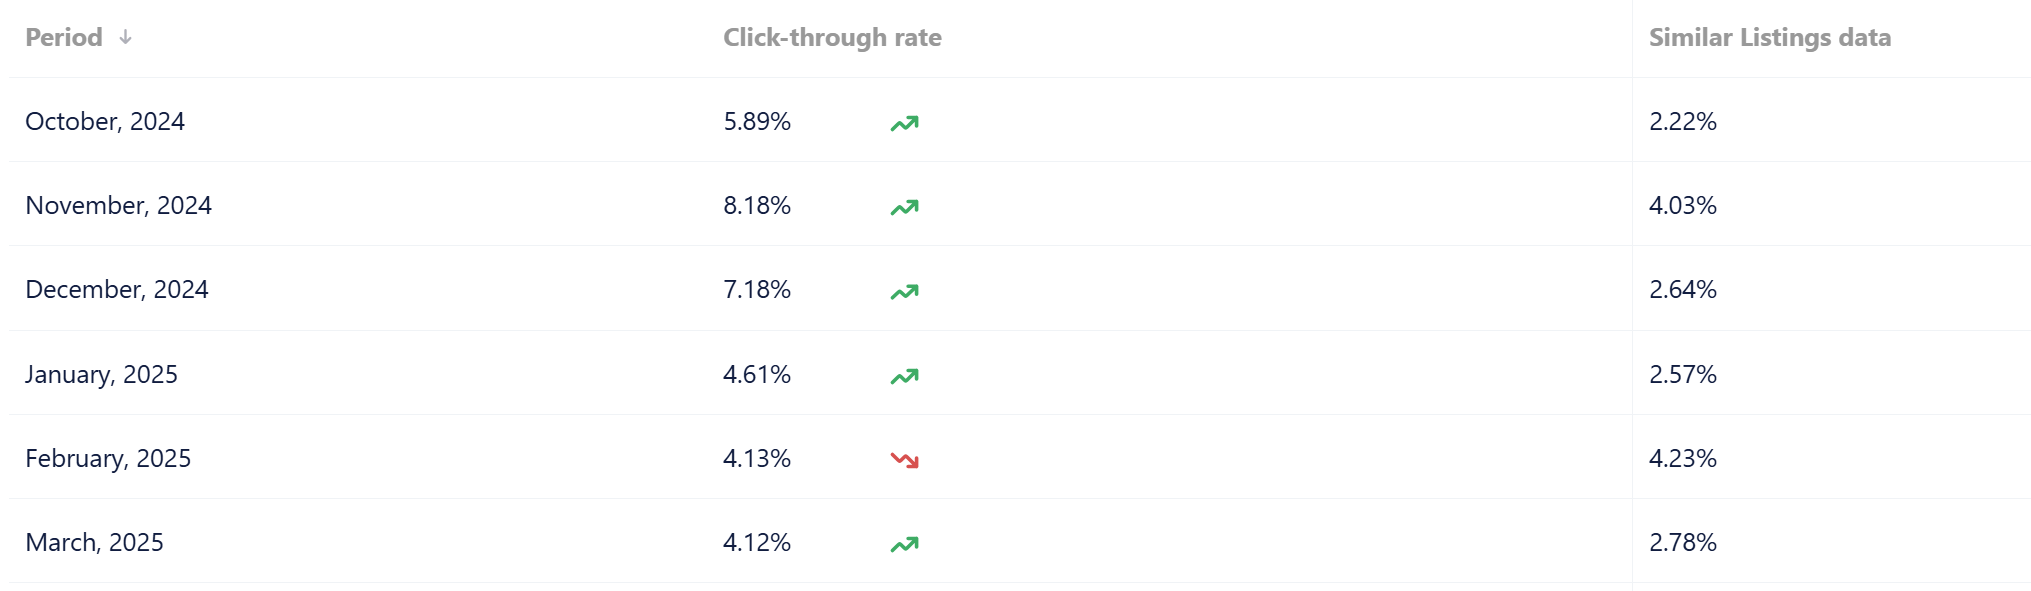
The low-performing property also had slightly higher click-through rates than similar listings, but just a bit higher.
Occupancy Rate
The occupancy rate is a key statistic. This is the percentage of days that the property was rented. We consider anything above 80 a good occupancy.
The occupancy rate of the high-performing property was awesome. Even during the low season, occupancy remained strong. In months such as Oct, which is the low season, the average occupancy was 20%, while our high-performing property had an occupancy in the 70s. In fact, occupancy was impressive even after the hurricanes at the end of 2024.
During the high season, the property was fully booked at 100%. We checked, and the longest booking was 7 days so this wasn’t a fluke.
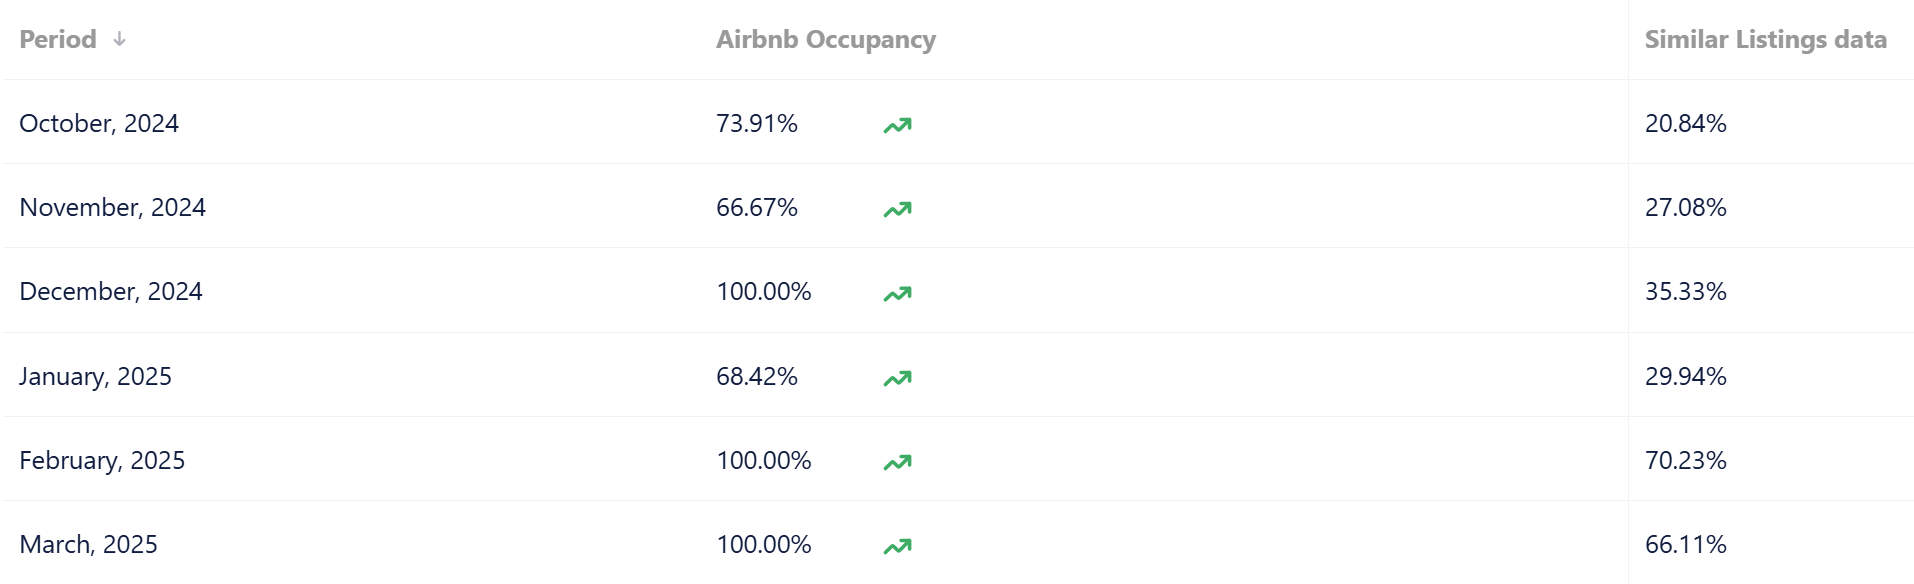
The low-performing had occupancy rates just a tad higher than similar listings.
Avg Daily Rates - ADR
The average daily rate, or ADR, is another key statistic as it has a direct impact on revenue. This one surprised us. During the low season, the high-performing property had a slightly LOWER average daily rate than similar properties.
During the HIGH season, it had a HIGHER average daily rate than similar properties. In fact, in months such as February, the ADR was close to 100/night higher than similar properties. These were the months with 100% occupancy.
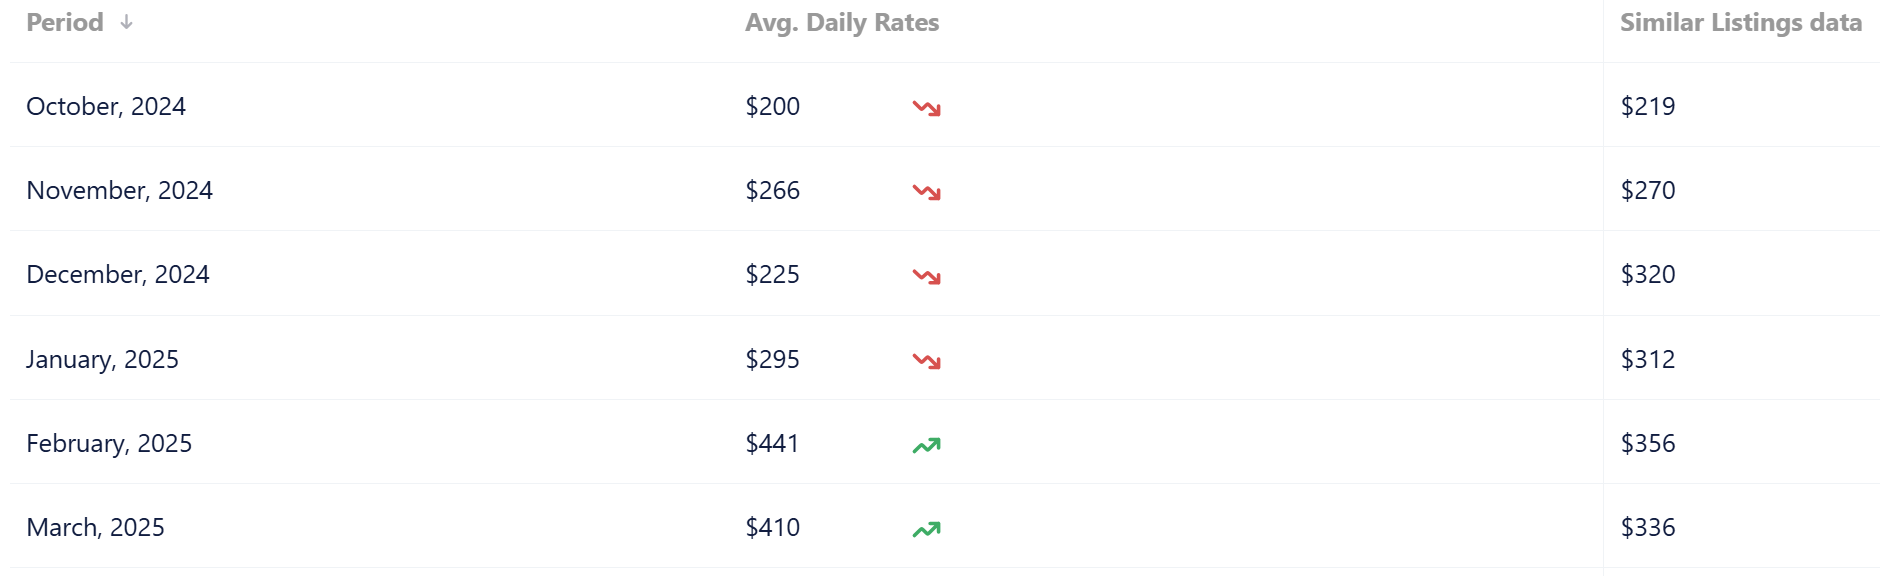
The low-performing property had a lower ADR than similar properties in both the high and low season. Hint - they were NOT using a good dynamic pricing engine.
WhishList
The Wishlist number is the number of times a guest or potential guest adds the property to their wishlist. Usually, when a guest is looking for a place to stay, they will add a handful of properties to their wishlist and then select one.
The number of Wishlists of the high-performing property was significantly higher than that of similar properties. In some months, it was four times that of similar properties. In January, nearly 100 potential guests added the high-performing property to their wishlists, while similar listings had only 15.
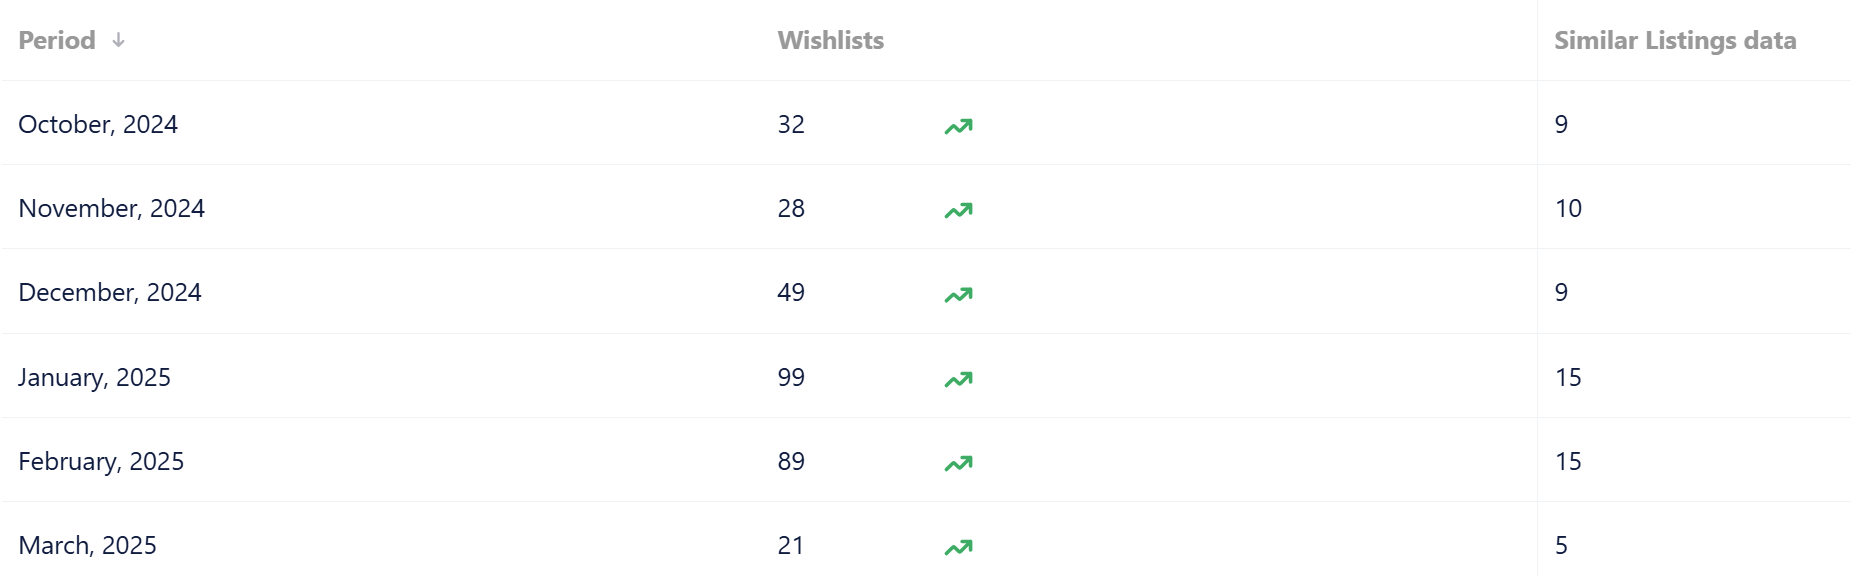
The low-performing property was just average. Some months a tad higher and some months a tad lower.
So yes, we analyzed, sliced, and diced a LOT of statistics for both properties.
Reviews
We also analyzed the reviews. In fact, we consolidated the reviews for both properties and used AI for some insights.
The reviews for the low-performing property were 'decent,’ with an average score of 4.7. In contrast, the high-performing property received a score of 4.98 and had significantly more reviews than the low-performing property.

The reviews of the high-performing property were also much longer. Guests were delighted with their stay and many (8% of the reviews) mentioned that they were coming back. In the low-performing property, not a SINGLE review mentioned that they were coming back, and very few reviews mentioned that they highly recommend.
The Secret Sauce
After analyzing all the numerical data and raw review information, here are the top five ingredients contributing to a high-performing property.
1. Reviews
Reviews are undoubtedly the most important ingredient. This makes sense, as the algorithm aims to prioritize STRs that guests will appreciate and want to return to. We believe that Airbnb is using AI to assess guests' happiness after their stay. In fact, we have observed a couple of cases where a review is rated 5 out of 5 in all categories, but the written review is mediocre. In one instance, the reviewer mentioned that the property was smaller than expected, and in another, they expressed a desire to be closer to the city center. In both cases, we noticed our page rank dropped after receiving this 5 out of 5 review.
Here is this precise scenario. The red dotted line is the 5/5 review, but with the ‘property was smaller than expected and far from the city center’. This lowered our page rank.
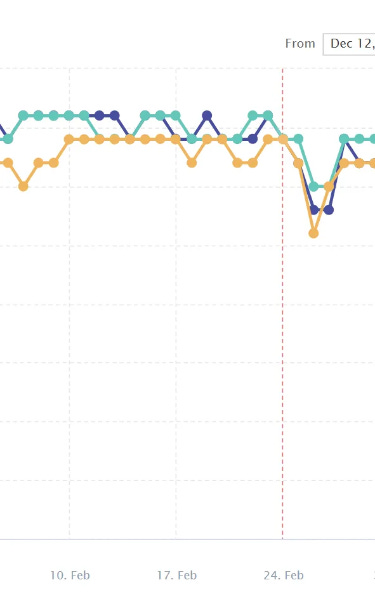
All 5/5 reviews are NOT the same. A long glowing review is worth a LOT more than a short review. In addition, quantity matters. Our properties that are near the top have more reviews.
Educate your guests on the importance of reviews.
2. Dynamic Pricing Engine
The second most important ingredient is a well-tuned dynamic pricing engine. Notice the term "well-tuned." We use WheelHouse (click for $20 off your first month) at most of our properties, but we have also used PriceLabs, which has worked very well too.
Each market has slightly different tuning requirements. The nice thing about a dynamic pricing engine is that it will adjust the nightly rate automatically based on:
Market Demand & Seasonality
Competitor Pricing
Local Events & Holidays
Booking Trends
Length of Stay
Occupancy Levels
Lead Time (How Far in Advance the Booking Is)
Reviews & Ratings
External Factors (such as weather or events)
If you are not using a dynamic pricing engine, try it. Tuning a pricing engine is more of an art than science, but it is not rocket science.
3. Wishlists
Having your property whitelisted is also an important factor. In all of our well-performing properties, we have a higher wishlist number than the average. For some of these properties, the rate is MUCH higher. We know that Airbnb’s algorithm will rank your property higher if it is whitelisted more.
We now actually ask guests who enjoyed their stay to also add our properties to their wish list. Many guests have responded that they have wishlisted our property.
4. Main photo
The photos in your listing are super important. We could write a whole blog on just photos and best practices: Tips on ordering, angles, lighting, etc. Unless you are really good with your iPhone, have a professional take photos of your listing.
But the most important item is to have a good and catchy first photo. This is one of the items that will cause someone to click on your listing vs another.
You can just experiment with your main photo to see if one gives you a higher click thru rate.
A while back when trying to get a property to perform better in the low season we happen to get a good photo of our dog sitting by the fireplace. The photo was a little guffy, but our dog appeared to be showing the place so we thought it was neat.
We added this as the main photo, and our click-through rate began to rise. Within four weeks, our page rank was near the top and remained there. For this property, this was the key ingredient.
So remember to experiment with your main photo.
5. The Guest Experience
This should actually be the first item. In the STR world you are in the hospitality business. If your STR is simply a place to sleep, it will be a mediocre experience for the guests. In cities like Tampa, FL, the vast majority of the properties that are no longer an STR are the ones giving guests a mediocre experience.
By digging deep into the reviews and the conversations with guests at both the high and low performing properties, we were able to identify key elements that contributed to an awesome guest experience.
Here are the ingredients to a great guest experience.
Communication
The first item was communication with guests. The high-performing property had message workflows that were always executed on time and automatically, and all communication was clear. The low-performing property had room for improvement. Some of the messages were too long and not to the point.
Ensure you know when to communicate what. The messages should be clutter-free and to the point. We have a blog about this.
The Kitchen
The second item is the kitchen. Guests who stay in STRs often enjoy cooking at home.
All of our properties, including this high-performing one, typically feature a well-equipped kitchen. We provide items such as a coffee grinder, rice cooker, air fryer, waffle maker, and more. When we stay in our own properties, these are the kitchen items we appreciate having. The low-performing property was initially set up by a large STR for-profit company. Someone with a checklist purchased the bare minimum. One of the reviews captured this sentiment well, stating, “the kitchen was soul-less."
Items to Delight
This is a category we created after conducting our research. Both properties are near the beach, but one was designed to delight guests, while the other had just the bare minimum.
As an example, the lower-performing property had a pool heater, but it was set to no higher than 80 degrees, leading to frequent guest complaints about the water being too cold.
In contrast, the high-performing property maintained its pool at 86 degrees, using both solar and electric heaters. Guests could request either a higher or lower temperature. When the sun was shining, this didn't add much to costs, and we had no issues cranking the solar heater up to the 90s.
Another example was beach supplies. The low-performing property, equipped by an hourly employee with a check-list, had a couple surf boards, sand toys, and two beach chairs.
The high-performing property, equipped by my wife and son, featured eight beach chairs, two umbrellas, a cart to haul the stuff, 4 small foldable tables, surf boards, floating toys, among other things. You get the picture. Any guest planning on spending a day at the beach would be delighted with all the supplies.
There are other small differences in the decor and backyard. The low-performing property was a little bland. The backyard was functional, but boring. The high-performing property had little solar lights and string lights that made the backyard look amazing at night.
By analyzing the back-and-forth communication, we also discovered several other small items that contributed to a great guest experience. Other items include having a QR code on the wall for both the Wi-Fi connection and the guest guidebook. A guidebook with many recommendations for things to do, restaurants, and info about the area. As one review summarized, “This property was very well designed”.
The other item to note is that the low performing property was NOT run in a way to delight guests. While reviewing historical communication with guests, we saw the co-host charging $20 for two broken plates, an extra $50 for a late checkout, very strict rules on having the grandparents over for dinner (in their 90s), etc. Guests do not like to feel nickel and dimed. We can dedicate an entire blog to tips and tricks for delighting guests, as well as the top 10 things to avoid.
In Conclusion
The high-performing property clearly costs more to equip and run. We tried to estimate how much more was spent:
Beach & pool supplied - $500
Backyard - $300
Kitchen - $1000
Pool solar heater - $6000
Misc - $2000
In total, we estimate an additional 10K was spent on the high-performing property setup. The extra setup time is difficult to quantify. However, we know that this additional setup time and the extra 10K are enabling this property to generate an yearly revenue of 85K compared to the low-performing property's 55K. Clearly, it paid off more than enough.
The fundamental difference was not only in how the property was setup/stocked, but how it was run. The low-performance previous style of management seemed to be trying to nickel and dime guests and save every penny it could. "Penny wise, pound foolish."
The million-dollar question now is: will it be possible to turn around the low-performing property? Can the 55K/year property become an 80K or 85K/year property and if so, how long would it take? Will a new listing be needed?
Thanks for reading!!
P.S. Wondering if cohosting is right for your property? Let’s talk it through — reach us at [email protected]
Guests can tell when a property was stocked from a checklist instead of by someone thinking through the actual stay. The beach chairs, warm pool, good kitchen tools, and small lights outside are not fancy, but they change the whole feel.
Nickel-and-diming guests over broken plates in a saturated market feels like a fast way to stay average.